Global pension accounting snapshot – 31 March 2026
Overview of the key issues for those involved in global defined benefit (DB) pension plan accounting.
Key trends over Q1 2026
- Corporate bond yields have increased over the quarter to 31 March 2026 in the major economies. Corporates are therefore likely to see an increase in their IAS19 discount rates for their pension liabilities, which will reduce the value of the corresponding defined benefit obligations.
- Global equity markets were mixed and volatile, rising early in the quarter before falling sharply in late February and early March as the Iran war drove an energy shock and subsequent sell off from investors. This will lead to mixed results in plan asset values over the quarter for corporates with funded DB plans with growth-oriented investment strategies with UK and Japanese equity markets seeing a slight increase at 31 March 2026 compared to the position at 31 December whereas the US and European equity markets saw a slight decrease.
Discount rate assumptions and key local issues
The table below shows IAS19 discount rate assumption ranges at 31 March 2026 that we typically expect in major DB pension markets globally, as well as some of the key pension accounting issues in those countries.
|
Country |
Indicative IAS19 discount rate range |
Key issues in local market |
||
|
Short |
Medium |
Long |
||
|
Eurozone |
2.8% – 4.1% |
3.8% – 4.3% |
4.2% – 4.6% |
Netherlands: The new pension legislation (Wet Toekomst Pensioenen) could impact balance sheet and P&L. |
|
UK |
5.5% – 6.1% |
5.9% – 6.3% |
6.2% – 6.4% |
The Virgin Media legal case may require further investigation and potential for additional disclosures. However, there is draft legislation pending which is intended to mitigate the impact. |
|
USA |
4.8% – 5.6% |
5.4% – 5.9% |
5.6% – 5.9% |
Pension risk transfer (PRT) activity was strong at the end of 2025 with plan sponsors taking advantage of favourable market conditions. Annuity buy-in activity was up more than 400% in 2025 compared to 2024, while overall PRT volume was slightly lower. |
|
Canada |
4.3% – 4.7% |
4.7% – 5.1% |
5.1% – 5.4% |
New mortality tables (CPM2024) were released in March 2026. The combined impact of using the new mortality tables and the latest mortality improvement improvements scales (CanMI-2024) is estimated to increase liabilities and current service costs by c. 2% to c. 3%. |
|
Mexico |
9.4% – 9.7% |
9.9% – 10.0% |
10.0% – 10.1% |
No notable key issues currently in Mexico. |
|
China |
1.2% – 1.8% |
1.8% – 2.1% |
2.2% – 2.7% |
No notable key issues currently in China. |
|
India |
5.9% – 7.1% |
7.2% – 7.5% |
7.5% – 8.0% |
No notable key issues currently in India. |
|
Indonesia |
5.9% – 6.9% |
7.0% |
7.0% |
No notable key issues currently in Indonesia. |
|
Malaysia |
3.6% – 4.0% |
4.0% – 4.3% |
4.3% – 4.8% |
No notable key issues currently in Malaysia. |
|
Singapore |
1.5% – 2.2% |
2.3% – 2.4% |
2.4% – 2.5% |
No notable key issues currently in Singapore. |
|
Thailand |
1.1% – 2.2% |
2.2% – 2.9% |
3.0% – 3.6% |
No notable key issues currently in Thailand. |
If you would like to discuss the above in further detail or would like insights for any other countries, please get in touch.
Movement in corporate bond yields
The chart below shows the change in the yields on AA-rated Sterling, US Dollar and Euro denominated corporate bonds over the quarter to 31 March 2026.
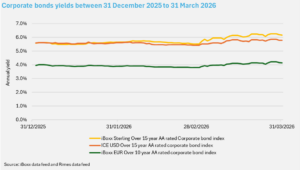
Since 31 December 2025, corporate bond yields have increased across all three regions. Eurozone and US yields have both risen by c. 0.2%, while UK yields have seen a larger increase of c. 0.6% over the quarter. Multinationals are therefore likely to see a decrease in DB liability values across all three regions.
Growth asset performance
The chart below shows the performance of equity markets in the UK, US, Europe and Japan over the quarter to 31 March 2026.
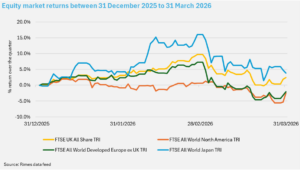
Global equity markets experienced a volatile quarter with mixed overall performance. UK, European and Japanese markets rallied through January and into late February. However, this trend reversed sharply towards the end of February and into March, primarily driven by the escalation of the Iran war. The conflict triggered a significant energy shock, with disruption to key supply routes such as the Strait of Hormuz pushing oil prices sharply higher and raising global inflation expectations. As a result, volatility increased over March with investors moving away from growth assets amid heightened geopolitical uncertainty.
Over the quarter, Japan was the strongest performing market, delivering returns of c. 4%, albeit with notable volatility. The UK also posted positive returns of c. 2%. In contrast, USA and Europe experienced slightly negative returns of around c. 2-3%. Corporates with funded DB plans with growth-oriented investment strategies are therefore likely to have seen a slight increase in the value of their UK and Japanese equity investments at 31 March 2026 compared to the position at 31 December but a slight decrease in their US and European equity portfolios.
Contacts

Elliot Colman
Global Benefits Consultant
VIEW PROFILE
Email:
elliot.colman@mbwl-int.com
Tel: +44 (0) 20 3949 5711
Elliot Colman
Global Benefits Consultant
Elliot is a Global Benefits Consultant for MBWL and is based in London. He joins MBWL from PwC where he started his career over 7 years’ ago. He has experience working as both a corporate pensions actuary before moving into a M&A team specialising in global defined benefit plans.
He brings expertise in advising both large multinational companies and private equity firms on global defined benefit plans, equity plans, and other employee related issues over the course of a deals cycle, including buy-side and vendor due diligence and bespoke strategic advice for sale.
Elliot graduated from the University of Nottingham with a first-class degree in BSc (Hons) Financial Mathematics and is a Fellow of the Institute of Actuaries in the UK.

Isabel Coles
Head of International Consulting, MBWL International
VIEW PROFILE
Email:
isabel.coles@mbwl-int.com
Tel: +44 20 3949 5710
Isabel Coles
Head of International Consulting, MBWL International
A multilingual expert in employee benefits for multinational corporates.
Isabel heads up MBWL International, advising multinational organisations on their employee benefits arrangements around the world, with a focus on corporate sales and purchases, accounting disclosures and the financing, risk management and design of benefit plans.
Her vast experience includes leading global accounting consolidations under international, UK and US accounting standards for multinational companies headquartered in the UK and overseas – with consolidations ranging in size from two to over 50 defined benefit plans.
She has advised both corporate and private equity buyers on the employee benefit considerations (including pension liabilities) associated with corporate sales and purchases in Europe and worldwide, from due diligence through to closing and subsequent integration work. Isabel has also undertaken many benefit audits and benchmarking exercises, including a 25-country audit for a company in the technology sector.
Other areas of Isabel’s expertise include reviewing and establishing international pension plans, advice on individual expatriate employee benefit packages and supporting multinationals in agreeing and implementing global governance approaches and policies for managing their employer benefit plans.
Isabel chairs the International Committee of the Association of Consulting Actuaries and is fluent in German and French.
Contacts
Elliot Colman
Global Benefits Consultant
VIEW PROFILE
Email:
elliot.colman@mbwl-int.com
Tel: +44 (0) 20 3949 5711
Elliot Colman
Global Benefits Consultant
Elliot is a Global Benefits Consultant for MBWL and is based in London. He joins MBWL from PwC where he started his career over 7 years’ ago. He has experience working as both a corporate pensions actuary before moving into a M&A team specialising in global defined benefit plans.
He brings expertise in advising both large multinational companies and private equity firms on global defined benefit plans, equity plans, and other employee related issues over the course of a deals cycle, including buy-side and vendor due diligence and bespoke strategic advice for sale.
Elliot graduated from the University of Nottingham with a first-class degree in BSc (Hons) Financial Mathematics and is a Fellow of the Institute of Actuaries in the UK.
Isabel Coles
Head of International Consulting, MBWL International
VIEW PROFILE
Email:
isabel.coles@mbwl-int.com
Tel: +44 20 3949 5710
Isabel Coles
Head of International Consulting, MBWL International
A multilingual expert in employee benefits for multinational corporates.
Isabel heads up MBWL International, advising multinational organisations on their employee benefits arrangements around the world, with a focus on corporate sales and purchases, accounting disclosures and the financing, risk management and design of benefit plans.
Her vast experience includes leading global accounting consolidations under international, UK and US accounting standards for multinational companies headquartered in the UK and overseas – with consolidations ranging in size from two to over 50 defined benefit plans.
She has advised both corporate and private equity buyers on the employee benefit considerations (including pension liabilities) associated with corporate sales and purchases in Europe and worldwide, from due diligence through to closing and subsequent integration work. Isabel has also undertaken many benefit audits and benchmarking exercises, including a 25-country audit for a company in the technology sector.
Other areas of Isabel’s expertise include reviewing and establishing international pension plans, advice on individual expatriate employee benefit packages and supporting multinationals in agreeing and implementing global governance approaches and policies for managing their employer benefit plans.
Isabel chairs the International Committee of the Association of Consulting Actuaries and is fluent in German and French.